2
ARTICLE
記事
2
ARTICLE
記事
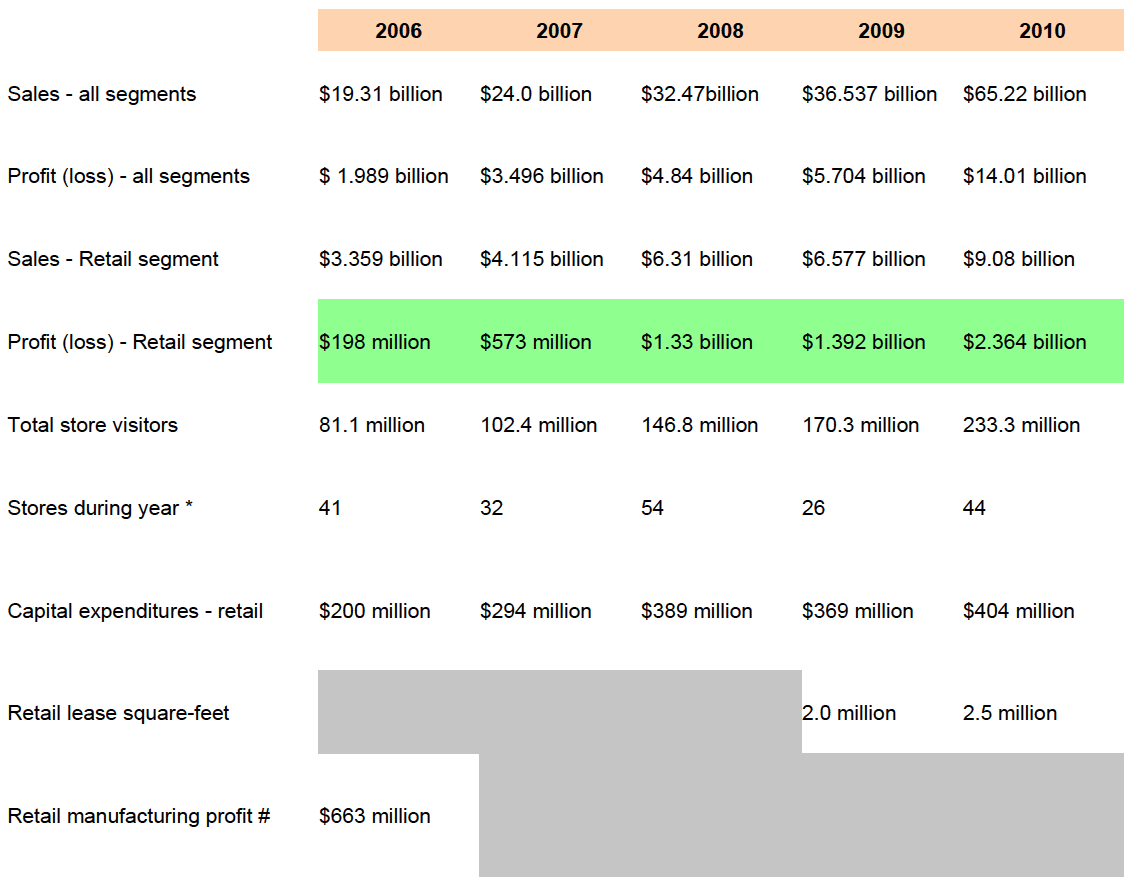
Directions: Read the following table.
課題: 以下の表を読み解いて説明しましょう。
SHL Sales Comparison
Directions: First repeat after your tutor and then read aloud by yourself.
Directions: Read the questions aloud and answer them.
課題: 質問を声に出して読んだ後、答えてみましょう。
1. What year did SHL make the most profit?
2. Did the total store visitor number increase every year for SHL?
3. Why do you think the number of stores decreased in 2009?
4. What do you think the numbers will be like for 2011?